ROS course 012: Rviz Summary
1. Summary
THis post is tested under the following conditions:
| Item | Value |
|---|---|
| CPU | AMD Ryzen 5 2600 |
| Ubuntu | 18.04 |
| ROS | Melodic |
For installation, see 02 Install. The source code of all parts is upload of github, see 11 git for more detail.
2. Summary
rviz (ROS visualization) , abbreviation for ROS visualization, is a powerful 3D visualization tool for ROS. It allows the user to view the simulated robot model, log sensor information from the robot’s sensors, and replay the logged sensor information. By visualizing what the robot is seeing, thinking, and doing, the user can debug a robot application from sensor inputs to planned (or unplanned) actions
3. Feature
3.1. Example 1
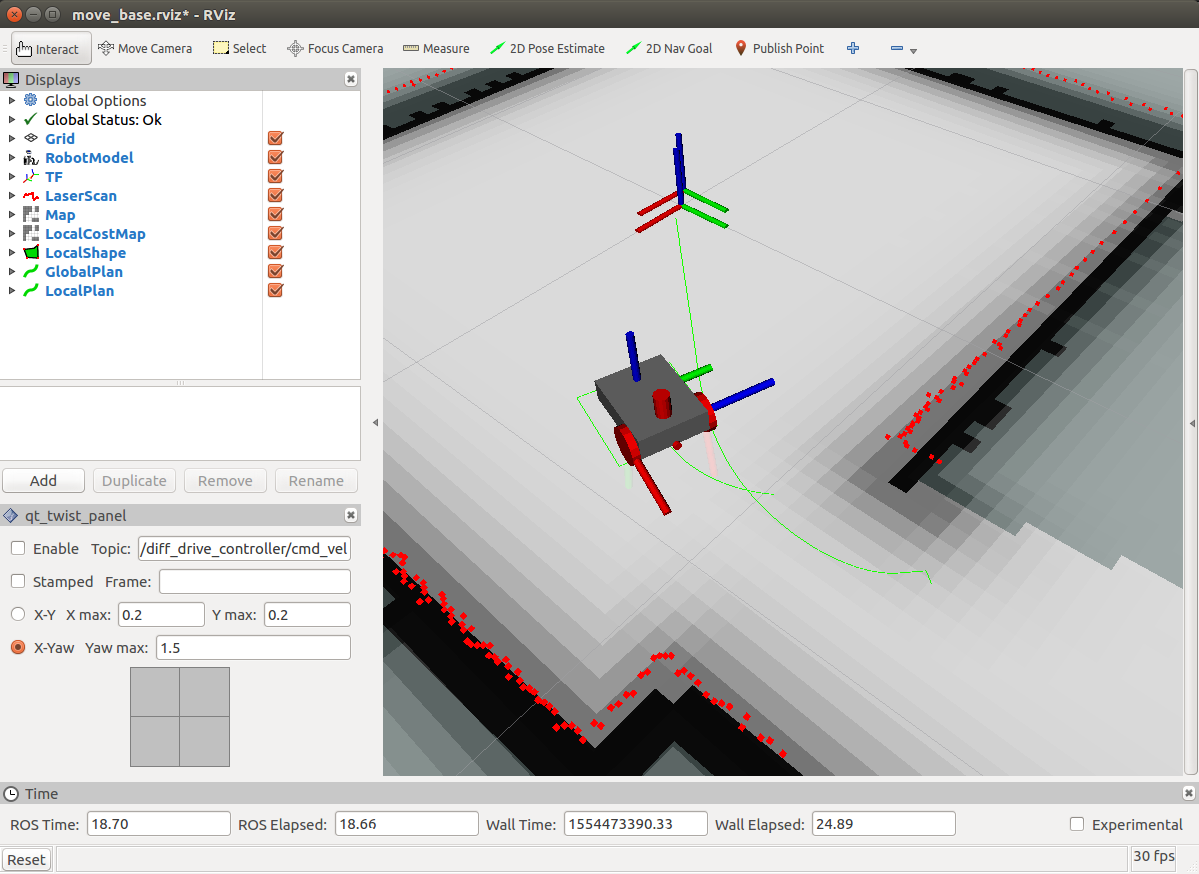
rviz’s gui is as follow:

- 3DView(Displaying robot’s state): displaying robot’s position, angle, etc. We can monitor robot’s current state without looking at the robot herself. This screen can also display data of other sensors such as LIDAR, camera, etc
- OverView(Displaying warning message, Debug value)
- Panels (camera’s image)
- Control pannel
3.2. Example 2
In this example, robot use lidar data and slam to genarate surrounding map.
3.3. Limitation
- rviz is visualizer tool
- rviz is not simulator (ROS’s simulator is gazebo)
- rviz will not automatically monitor sensors’ data and robot’s states. we need to implement the data-publishing code by ourself
4. How to use rviz
- Writte URDF file to create model of robots (model of robots = collection of joint and link)
- Start robot (real or simulator)
- Start rviz
Leave a comment